One of the toughest hurdles for new Power BI users is data modeling. If you’ve never been exposed to data modeling concepts before, terms like entities, facts, dimensions, keys, and relationships may be puzzling. This two-part article is a simplified introduction to data modeling in Power BI.
What is data modeling?
For our purposes, we’ll define data modeling in simple terms along with data modeling aliases: Data modeling is connecting (relationships) data tables (entities) through matching fields (keys) in a way that allows us to filter, aggregate, and analyze table columns (attributes).
How is data modeling represented in Power BI?
In Power BI, this is handled in the Model tab (third tab on the left). Let’s define our new terms in Power BI context:
- Entities are the tables we load using Power Query.
- Relationships are how we connect our entities on the Model tab using one of three methods: One-to-one, one-to-many, and many-to-many. One-to-many is the most common method for relating two entities.
- Keys are the fields in an entity that relate it to other entities.
- Once connected, we can select or filter one entity (say in the axis of a Power BI visual) and analyze the attributes of connected entities (the values of a visual).
Entities are concepts that the data define, e.g. business concepts such as manufacturers, products, and sales. The relationship between these entities can be thought of like this: One manufacturer (i.e. one row on a manufacturer table) makes dozens of products (dozens of rows on a products table). By relating these two, we can look up all products made by a manufacturer, and vice versa: we can look up the manufacturer attributes for one product. Let’s look at an example of this.
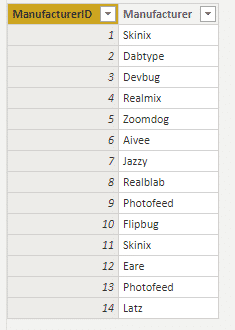
Note the unique ManufacturerID values in the Manufacturer table compared to the repeating values in the Products table. This is an easy indication of a one-to-many relationship.
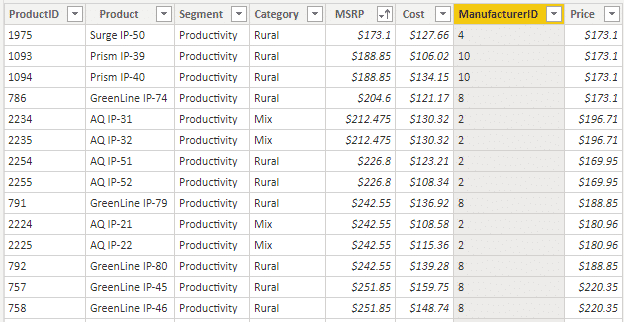
Key fields are often notated with the suffix ID. We can see that our Manufacturers table has a ManufacturerID field. The Product table has ManufacturerID and ProductID fields. And our Sales table has a ProductID column. Let’s connect these tables to each other to see how relationships work. When creating relationships, you can drag the field from one table to the matching field in the other, but you may want to use the Manage Relationships function at the top of the screen. We’ll use both in this example.
First let’s drag ManufacturerID in the Manufacturer table to the matching field in the Products table.
Now let’s use Manage Relationships to connect our ProductID in the Products table to the matching field in the Sales table.
You’ll see that these relationships are one-to-many types, meaning the table notated with the 1 has unique values, and the table with the * repeats those values, referring to the unique value for attributes. Our Manufacturer table has 14 unique values that are repeated in the 353 rows in the Product table. We’ll explore other relationship types in a future post.
Now let’s represent these data in our report view. We’ll create a slicer visual with the Manufacturer column from the Manufacturer table. Then we\’ll create a bar chart visual with the Product column from the Product table as the visual axis and the Total Sales Amount measure (sums our sales in the Sales table) as the visual value. We can now use the slicer to filter the bar chart to only see product sales for the selected manufacturer. Using a dimensional data model to create these visuals is a crucial feature of Power BI report design.