Time Intelligence in Power BI can be a beast sometimes and this use case is no different. When it comes to slicing and dicing your data using dates and other time intelligence measures, there are many approaches, but this method excels at saving page space while producing dynamic results across multiple metrics with a click of a button. Imagine you have a large sales data set that a client would like to be able to slice according to industry standard time periods such as month-to-date, last year, etc. They’d like to quickly see the filtered data in their report without having to manually select or input date ranges for every single time period. Creating individual measures could attain this, but at the expense of a lot of slicers on the pages. Therefore, an aggregated slicer needs to be created to consolidate all the different filters.
In our pursuit of building a better user experience and smoother navigation, we built an ad hoc slicer to filter metrics by selective time periods (e.g. WTD, MTD, QTD, YTD, etc). The purpose of the slicer is to allow visually appealing time intelligence navigation of the data and give the user a clear picture of their sales, leads, and collections on one page.
When presented with the challenge, we researched common solutions, but also rarer options since the requirements we were dealing with didn’t lend itself to using the vanilla slicers in Power BI. After some digging, we did end up finding a hacky slicer solution that was primarily used in financial data reporting—so naturally we “borrowed” it for sales data. It’s ingenious and quite simple in theory, but in practice the setup is rather cumbersome and time consuming. Once completed, the resulting slicer makes date and time intelligence slicing a breeze.

Without further ado, the main components of the slicer are the following: dynamic, sound time intelligence measures — filtering an aggregate measure by month to date or last quarter for example, a simple switch statement, and a table with a selector and reference column. The idea is to create a table with two columns (selector column & reference column) and a switch statement measure (using the discreet measures to proc which filter gets applied to the data). Let me explain.
To illustrate this, we used the “Sales and Marketing Sample” data set (aka World Wide Importers) used in the Microsoft Dashboard In A Day. We loaded and edited the data just as outlined in the DIAD, but changed a few things:
For our purposes, we needed a full date table which we created in M. The M code is below.
letSource =
Csv.Document(File.Contents(“C:UsersCDeNysschenDesktopDIADsales.csv”),[Delimiter=”,”, Columns=5, Encoding=1252, QuoteStyle=QuoteStyle.None]),
#”Promoted Headers” = Table.PromoteHeaders(Source, [PromoteAllScalars=true]),
#”Changed Type” = Table.TransformColumnTypes(#”Promoted Headers”,{{“ProductID”, Int64.Type}, {“Date”, type date}, {“Zip”, type text}, {“Units”, Int64.Type}, {“Revenue”, type number}}),
#”Appended Query” = Table.Combine({#”Changed Type”, #”International Sales”}),
#”Added Conditional Column” = Table.AddColumn(#”Appended Query”, “CountryName”, each if [Country] = null then “USA” else [Country]),
#”Removed Columns” = Table.RemoveColumns(#”Added Conditional Column”,{“Country”}),
#”Renamed Columns” = Table.RenameColumns(#”Removed Columns”,{{“CountryName”, “Country”}}),
#”Changed Type1″ = Table.TransformColumnTypes(#”Renamed Columns”,{{“Country”, type text}, {“Revenue”, Currency.Type}}),
#”Filtered Rows” = Table.SelectRows(#”Changed Type1″, each true)
in
#”Filtered Rows”

Then, since the slicer uses TODAY’s date as reference and the data set data only goes until December 31, 2018, we used the EDATE DAX function in a calculated column in the Sales table to shift the data up by 12 months to 2019. This step is not necessary for live data, but for the purpose of this demo since there is no data recorded at the time of writing this post.
UpdatedSalesDate = EDATE(Sales[Date],12)

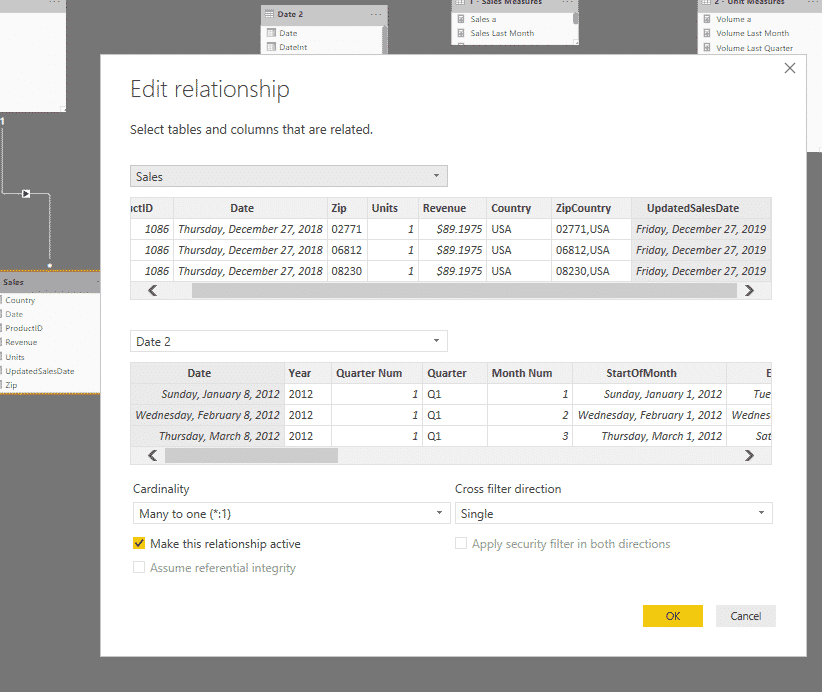
Once this was done, we created a new relationship between ‘Date’[Date] and ‘Sales’[UpdatedSalesDate] to feed the right dates.

These changes create the backbone of the data model and the date table is required for the slicer to work. However, the disconnected table and associated measures are the sweet sauce for creating our dynamic slicer.
In the next part of this blog, we’ll get into the meat of the project where we finally build out the slicer.
The data set can be accessed here:
https://docs.microsoft.com/en-us/power-bi/sample-sales-and-marketing
Eager to learn IronEdge’s advanced approach to data slicing for improved functionality across report pages? Check out our webinar recap here and advanced training courses! Rather hand off the complexities of Power BI to the pros? Reach out to our team. We’re here to help.
IronEdge Group Recognized on CRN’s 2024 MSP 500 List

Houston, Texas, February 12, 2024 — IronEdge Group is honored…
